[ Mamburao | Abra de Ilog | Calintaan | Looc | Lubang | Magsaysay | Paluan | Rizal | Sablayan | San Jose | Sta. Cruz ]
San Jose, Occidental Mindoro

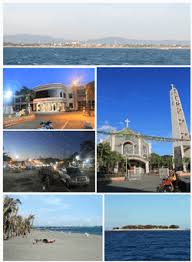
The Municipality of San Jose, is a 1st class municipality in the province of Occidental Mindoro, Philippines. According to the 2015 census, it has a population of 143,430 people[3], which represents a third of the provincial population, and the largest among cities (excluding Puerto Princesa City) and municipalities in the MIMAROPA region.
San Jose has the largest commercial port and airport in the province. The town also has the most banking, business, dining and commercial establishments in Occidental Mindoro, and has become a center of trade in the MIMAROPA region.[4] Its major local and international exports include rice, salt and processed milkfish. San Jose ranked 13th placer for the “Overall Competitiveness” among Philippine local government units in the 2017 Cities and Municipalities Competitiveness Index (CMCI).[5]
In pre-colonial times, it was named Pandurucan by the indigenous Mangyans, before later renamed for its patron saint, St. Joseph, the husband of Mary.
Mga Barangay
San Jose is politically subdivided into 39 barangays as of 11 January 2019.[13] Barangay Naibuan (PSGC 175110040) was created by virtue of Presidential Memorandum Order No. 19, series of 2018, pursuant to Sangguniang Panlalawigan Resolution No. 138, series of 2007 and ratified through a plebiscite on January 5, 2018.[14][15][16]
| PSGC | Barangay | Population | ±% p.a. | |||
|---|---|---|---|---|---|---|
| 2015[3] | 2010[17] | |||||
| 175110001 | Ambulong | 1.6% | 2,224 | 1,539 | ▴ | 7.26% |
| 175110002 | Ansiray | 0.7% | 1,032 | 945 | ▴ | 1.69% |
| 175110003 | Bagong Sikat | 4.6% | 6,564 | 6,096 | ▴ | 1.42% |
| 175110004 | Bangkal | 0.7% | 933 | 799 | ▴ | 3.00% |
| 175110005 | Barangay 1 (Poblacion) | 0.2% | 283 | 265 | ▴ | 1.26% |
| 175110006 | Barangay 2 (Poblacion) | 0.3% | 415 | 391 | ▴ | 1.14% |
| 175110007 | Barangay 3 (Poblacion) | 0.9% | 1,323 | 1,113 | ▴ | 3.35% |
| 175110008 | Barangay 4 (Poblacion) | 0.3% | 500 | 473 | ▴ | 1.06% |
| 175110009 | Barangay 5 (Poblacion) | 1.1% | 1,569 | 1,524 | ▴ | 0.56% |
| 175110010 | Barangay 6 (Poblacion) | 0.3% | 398 | 450 | ▾ | −2.31% |
| 175110011 | Barangay 7 (Poblacion) | 0.3% | 436 | 437 | ▾ | −0.04% |
| 175110012 | Barangay 8 (Poblacion) | 0.2% | 348 | 343 | ▴ | 0.28% |
| 175110013 | Batasan | 4.4% | 6,260 | 4,851 | ▴ | 4.97% |
| 175110014 | Bayotbot | 1.7% | 2,492 | 2,081 | ▴ | 3.49% |
| 175110015 | Bubog | 6.5% | 9,356 | 8,134 | ▴ | 2.70% |
| 175110016 | Buri | 0.4% | 607 | 484 | ▴ | 4.41% |
| 175110017 | Camburay | 1.3% | 1,849 | 1,856 | ▾ | −0.07% |
| 175110018 | Caminawit | 8.5% | 12,223 | 10,564 | ▴ | 2.82% |
| 175110019 | Catayungan | 0.7% | 1,021 | 794 | ▴ | 4.90% |
| 175110020 | Central | 7.6% | 10,901 | 9,250 | ▴ | 3.18% |
| 175110021 | Iling Proper | 1.5% | 2,124 | 1,886 | ▴ | 2.29% |
| 175110022 | Inasakan | 0.4% | 625 | 581 | ▴ | 1.40% |
| 175110023 | Ipil | 0.6% | 789 | 587 | ▴ | 5.79% |
| 175110024 | La Curva | 2.1% | 3,034 | 3,270 | ▾ | −1.42% |
| 175110025 | Labangan Iling | 0.7% | 1,070 | 1,009 | ▴ | 1.12% |
| 175110026 | Labangan Poblacion | 6.8% | 9,683 | 8,872 | ▴ | 1.68% |
| 175110027 | Mabini | 2.0% | 2,938 | 2,584 | ▴ | 2.47% |
| 175110028 | Magbay | 3.0% | 4,299 | 3,651 | ▴ | 3.16% |
| 175110029 | Mangarin | 2.4% | 3,410 | 3,049 | ▴ | 2.15% |
| 175110030 | Mapaya | 5.6% | 7,982 | 7,349 | ▴ | 1.59% |
| 175110031 | Murtha | 4.2% | 5,985 | 5,279 | ▴ | 2.42% |
| 175110032 | Monte Claro | 2.7% | 3,855 | 3,506 | ▴ | 1.82% |
| 175110033 | Natandol | 1.1% | 1,521 | 1,062 | ▴ | 7.08% |
| 175110034 | Pag-asa | 7.8% | 11,232 | 12,701 | ▾ | −2.31% |
| 175110035 | Pawican | 1.6% | 2,295 | 2,149 | ▴ | 1.26% |
| 175110037 | San Agustin | 3.7% | 5,363 | 5,301 | ▴ | 0.22% |
| 175110038 | San Isidro | 1.2% | 1,785 | 1,844 | ▾ | −0.62% |
| 175110039 | San Roque | 10.3% | 14,706 | 14,119 | ▴ | 0.78% |
| TOTAL | 143,430 | 131,188 | ▴ | 1.71% | ||
